
Using the Dashboard
Last Updated: February 3, 2025
The Dashboard provides a powerful overview of your Forth Partner performance, your pipeline of tests, and the health of your clients.
It is the first screen you see when you login or can be accessed by pressing the Dashboard tab at the top of the screen (on a desktop device) or at the bottom of the screen (on a mobile device).
Let’s break down each of the sections of the Dashboard, so you can be the master of your account.
Test Pipeline
At the top of the screen are several sections that outline the different stages of the test journey (commonly referred to as your Pipeline) and how many clients you have each of those stages. This gives you an overview of your current state of play.
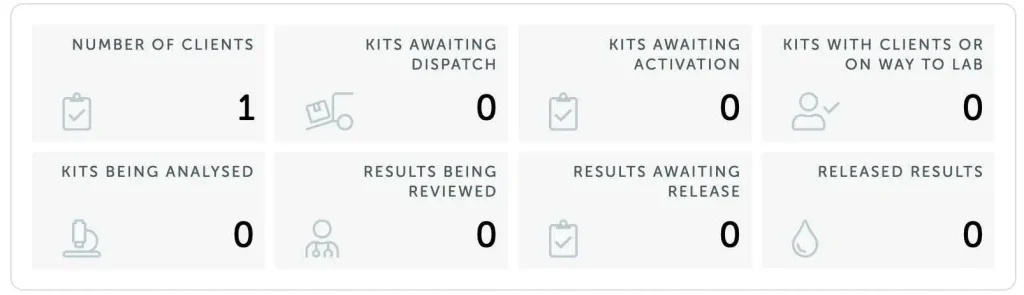
Definition of each metric:
- Number of Clients – the number of clients you have added to your Forth Partner Portal
- Kits Awaiting Dispatch – how many test kits are currently being processed at our fulfilment centre for your clients
- Kits Awaiting Activation – the number of test kits that have been purchased but have not yet been activated (linked to a Client)
- Kits With Clients Or On Way to Lab – how many test kits have been delivered to a Client but where a sample has not yet arrived back to our lab
- Kits Being Analysed – the number of test kits that have been received by our lab and are being analysed to generate results
- Results Being Reviewed – how many results are currently being processed by our Clinical team (where a test result review has not been refused by a Forth Partner / Client)
- Results Awaiting Release – the number of results that are awaiting final quality checks and approval to be published
- Released Results – how many results have been completed and published to your clients
Overview
Scrolling down a little further takes us to the Overview section.
The Overview section provides analysis of your performance as a Forth Partner, so you can celebrate your successes and where to put extra energy to drive results.
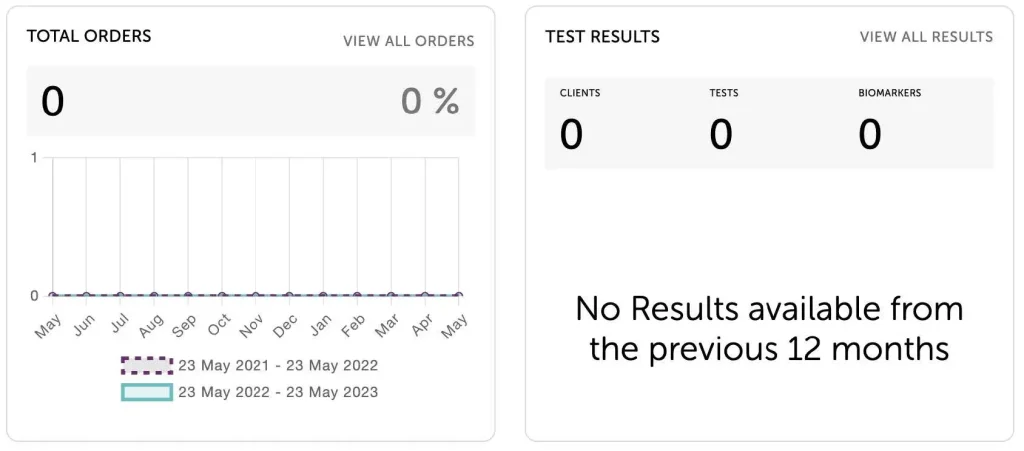
- Total Orders – provides a trend of how many total orders have been sold per month. The soliday blue line displays the last 12 months from today. The purple dashed line shows the 12 months prior as a comparison of sales trends year-on-year
- Test Results – details the total number of clients added, tests completed, and biomarkers analysed
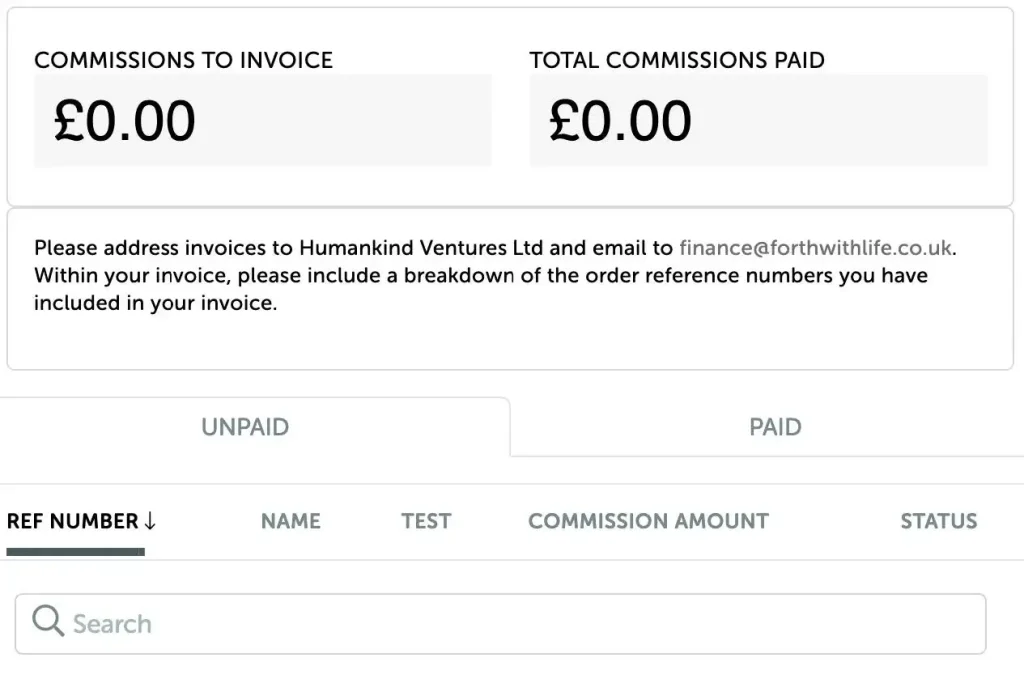
The next area outlines your sales performance as a Forth Partner:
- Total Kits Sold – the total number of kits that you have sold to your clients
- Average Order Spend – the average transaction value (ATV) of the kits you have sold to your clients
- Total Commission Paid – the total commission paid to you as a Forth Partner for the orders you have invoiced
- Commission To Invoice – the amount of commission due, but where Forth is awaiting an invoice for orders to be claimed
Learn more: How to claim your commission
Scrolling down, the next section outlines further useful metrics about your performance:
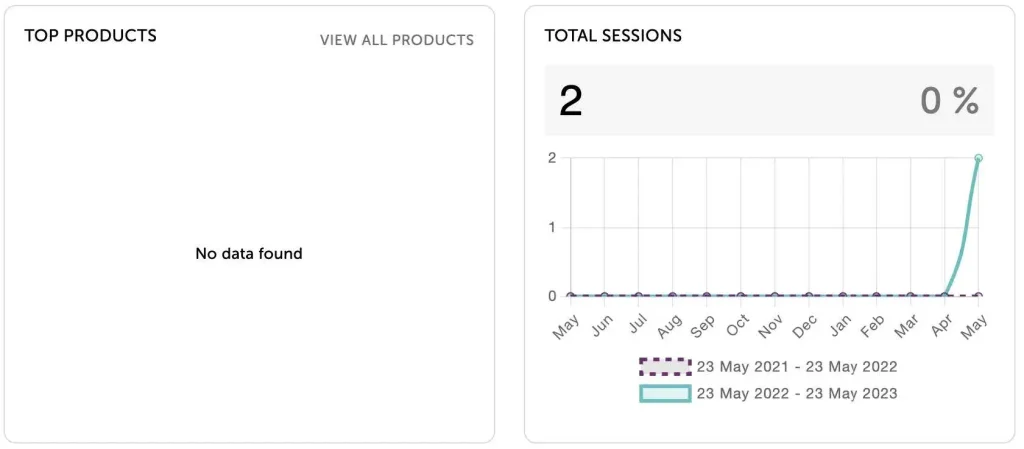
- Top Products – A list of the best selling products sold to your clients – this can be used to adjust what products you make available for sale
- Total Sessions – The total number of visits to your Forth Partner Store by month. The solid blue line shows the last 12 months from today. The purple dashed line shows the previous 12 months as a year-on-year comparison.
Your Clients
The last section of the Dashboard provides more information about your clients:
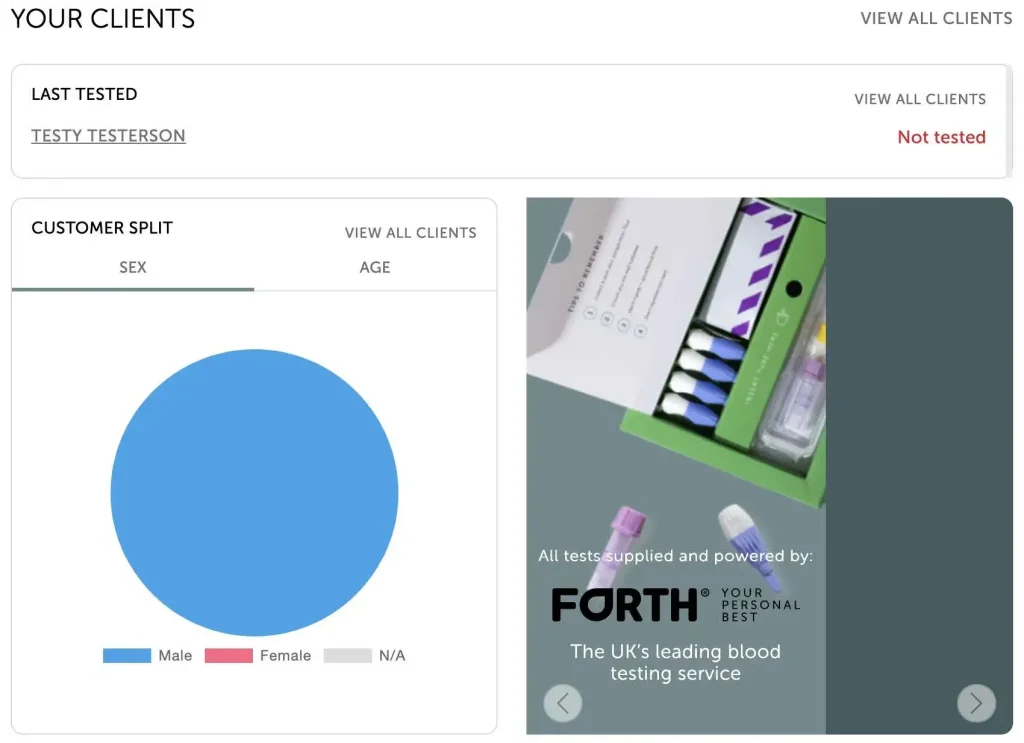
- Last Tested – provides a quick view of your clients and how recently they were tested. We recommend that clients should test their biomarkers every 6 months to track their health management
- Customer Split – a break down of the clients you have been added to your Forth Partner portal by Sex and Age.
We are dedicated to supporting you and your clients on their health journey. Need assistance? We are happy to help!